What you are looking at
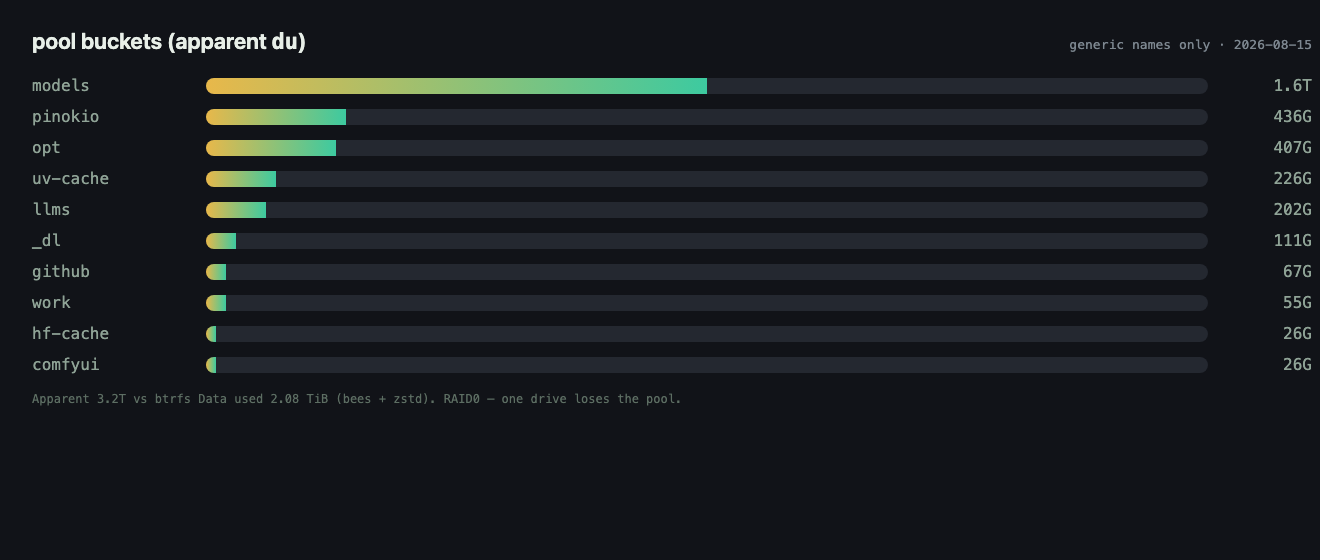
Live du -xhd1 + btrfs fi df from a two-NVMe RAID0 pool on 2026-08-15. bees was running. Apparent tree 3.2T vs btrfs Data used 2.08 TiB (bees + zstd). Hash occupancy omitted (beesstats unreadable after reboot). Grafana/Prometheus themselves were down — panels rebuilt from those numbers, not a logged-in admin UI.

fast-models / bees dedupe
sample · 2026-08-15 · last 24h
bees
UP
Data used
2.08 TiB
Data allocated
2.22 TiB
devices (raw)
3.68 TiB
Import
- Cron
deploy/observability/ai_data_stats_exporter.shevery 15 minutes on the NAS host. - node_exporter
--collector.textfile.directoryon that output dir. - Prometheus scrapes the node_exporter — see prometheus-scrape.example.yml.
- Grafana → Import → grafana-bees-dashboard.json (uid
fast-models-bees-dedupe).
Do not treat content-hash “reclaimable GB” as bees savings. That series is optional and only appears if you pass AUDIT_JSON.
Full notes: docs/observability/README.md